[Looker’s product is a “complete data platform that offers data analytics, exploration and insights to every function of a business… The company is powering data-driven cultures at more than 800 industry-leading and innovative companies such as Sony, Amazon, The Economist, Spotify, Sears, Kohler, Etsy, Lyft, Red Bull and Kickstarter.” The blog post below from the company’s website describes the creation of the company’s new data visualization tool that utilizes virtual reality, including some of the interesting challenges and possibilities of the immersive, presence-evoking format (note particularly the discussion starting with “It’s an interesting experiment that raises a lot of questions”). The blog post includes a 4:16 minute video, and a press release (quoted above) is available via Business Wire. –Matthew]
The Creation of LookVR
On the engineering team at Looker we regularly do hack days where we can put aside our normal project and try to come up with out-of-the-box or weird ideas that we’d never normally get to do as part of our real jobs. At the last hack day, I thought it might be fun to use Looker’s API to experiment with data visualization in virtual reality.
People have been experimenting with virtual reality a lot over the years, but until the latest round of headsets (the HTC Vive and Oculus Rift) it’s always felt like a toy. With a great developer community and VR tools built into all the major video game engines, it was really easy to start hacking around on getting Looker connected to a VR application.
The great thing about the Looker API is, when I started hacking, I didn’t have to hack on top of the raw dataset. I could simply connect to an existing data model and access all the rich transformations and business logic it contained. If I want to update the metrics, I can just do it in Looker and everything that points to it immediately updates. And by implementing my project on top of Looker, it means that the work I did is portable – if I want to use it on a different dataset I can just switch to it. It’s one API for any type of data.
This was particularly relevant because experiments in data visualization often take the form of extremely narrowly-focused visualizations that are only appropriate for a single dataset. There’s nothing wrong with that, but I thought it would be more of a challenge to build virtual reality visualizations that are general-purpose.
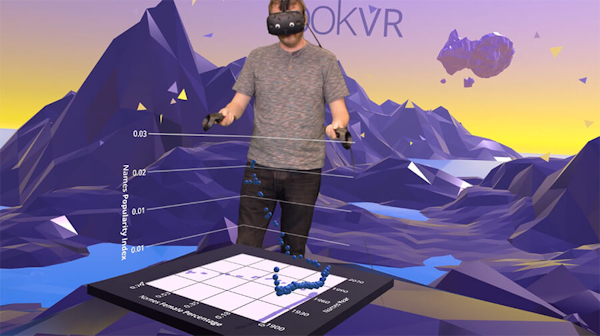
It’s an interesting experiment that raises a lot of questions. What were the fundamentals of data visualization in VR? How many simultaneous axes can you actually understand when they’re shown to you? Can you just use existing charts like scatter plots and column charts in VR? Or is there a totally new type of chart that is most appropriate for the medium?
What’s interesting here is that a lot of assumptions that data visualization aficionados usually make don’t directly apply to VR. For example, on a screen or paper, shadow, lighting, and 3D effects distract from the meaning of the data and can be misleading. Somewhat unexpectedly in VR, these things are all critical. Lighting, shadow, and depth are natural cues your brain uses to determine it’s location and how objects relate. They don’t distract you because it just looks real, and without them your depth perception and ability to understand relationships between data points would be hampered. Like all things with VR, it’s difficult to understand why this is the case without actually stepping into a VR headset. Screenshots and videos are still inherently 2D and won’t really convey how real and physical the experience feels.
It was also fun to explore new types of interaction mechanics. What’s the right way to do a “tooltip” in VR? How can someone easily get from one chart to another, or change filters and parameters in a medium where you can’t really type. This also leveraged the power of Looker’s API, which provides a lot of metadata about how datasets relate to each other, to let you build applications that can progressively drill into the details.
This experiment is called LookVR – it’s just a start but we think it’s interesting enough to share. If you’ve got an HTC Vive you can also download LookVR and try it out on our sample data. And if you’re a Looker customer, you can sign in and look at your own datasets in virtual reality.