[From Silicon Angle, where the story includes more pictures and a 16:47 minute video]
[Image: Microsoft]
Virtual Reality brings Big Data visualization to life
Mike Wheatley | May 29th 2014
Data visualization tools have made it somewhat easier to glean intelligence from a mass of information. But today’s tools are still extremely inefficient, as they fail to incorporate the science of human visual perception into their data visualization techniques. This results in tools that deliver great “eye candy” but poor human comprehension of the data.
Traditional tools also tend to visualize what we already know about the data, rather than the unknown. The ideal data visualization tool would let people find things that they don’t know, but should. Helping people find outliers, expose hidden trends or clusters, and dive deep into fast changing data sets is where visualization provides real value. But how can we go about doing so?
Perhaps the boffins at the Defense Advanced Research Projects Agency (DARPA) have the answer. We recently reported on its experiments with Oculus Rift, the virtual reality headgear recently acquired by Facebook, which are a fine example of the way VR can help us to better understand data. DARPA has modified Oculus Rift in such a way that futuristic cyberwarriors can visualize three-dimensional network simulations – in some cases with the goal of better targeting them for attack.
Getting ‘inside’ Big Data
One of the earliest pioneers in using Virtual Reality to view Big Data is Dr. Creve Maples, CEO of Event Horizon, who has undergraduate degrees from MIT and a Ph.D in Nuclear Science from the University of California, Berkeley.
In an extremely thought-provoking interview on theCUBE, Dr. Maples related how, more than ten years ago, his work as a nuclear scientist at Berkeley forced him to reinvent computing and develop new interfaces in order to immerse himself in data. Dr. Maples later expanded on his work as part of an advanced research program at Sandia, using fully immersible virtual reality environments to visualize data for the first time.
“We had the idea that this stuff puts you close to information, putting you in places you can’t go in real life,” explained Dr. Maples. “If you do this in a way that plays to the way humans function, the way they interact we found that learning would increase. We were so successful that it spun out as a private company that later went public”.
Dr. Maples’ Virtual Reality techniques have helped to solve numerous real world problems. In one example, he was approached by race car engineers from The Goodyear Tire & Rubber Company who’d struggled for more than two years to work out why they were always losing races.
“They hadn’t a clue,” stated Dr. Maples. “They didn’t know what they were looking for.”
Dr. Maples and his team spent two months building a virtual reality model for all of Goodyear’s data. They ended up with a virtual replica of Goodyear’s race car that engineers could immerse themselves in.
“Wheels on the car would morph in size as the pressure changed,” explained Maples. “Everything that was happening was exaggerated so that as you drove the car, you could see it and experience it.”
And within five minutes, Goodyear’s engineers found their answer.
The 3-D Web: A new world of Big Data
Dr. Maples isn’t alone in these efforts. Engineers at Caltech have also been experimenting with the use of immersive virtual reality (VR) spaces as a data visualization platform. They began by using virtual worlds, such as that in the MMORPG game Second Life and other open-source counterparts that use the Open Simulator (OpenSim) platform.
“Thus, a scientist can “walk” into their data, while interacting and collaborating with their colleagues in the same virtual space,” writes Alex Cioc, a sophomore at Caltech working on new data visualization techniques.
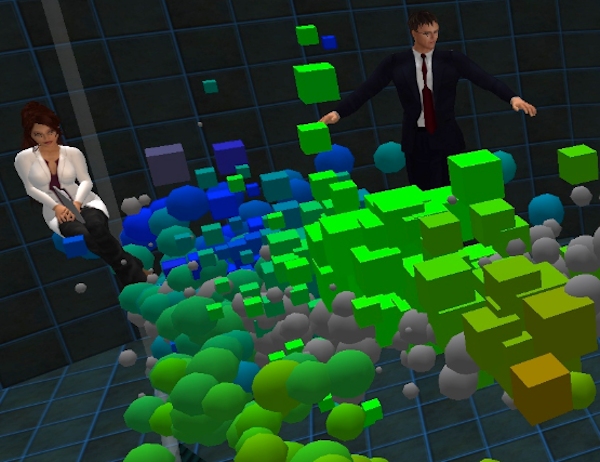
But of course, a virtual world designed for a computer game has plenty of drawbacks and technical limitations. That’s why Caltech engineers, working alongside Microsoft researchers, have begun development on a new 3-D data browser based on the Unity3D game development engine capable of rendering 100,000 data objects in about 15 seconds onto a bog standard 2011 Macbook Air.
“Our prototype data browser allows multiple forms of user control, and allows for the loading of local or external data sets,” writes Cioc. “Cross-platform users, which are represented by small cubes, can interact within the same space and control what they see.”
The 3-D data browser is just one tool Caltech is developing to better understand what it calls the “3-D web”. This PDF presents a nice overview of what the 3-D Web really is, but in a nutshell it refers to a future in which 3D technology is taken for granted and used extensively and naturally by everyone connected to the internet. The 3-D web’s enabling technologies encompass 3D video, games, virtual worlds, touchscreens, haptic interfaces and more – exactly the kinds of tools that Dr. Maples and his team have been playing with for years.
“There is nothing more important to the long-term health of the HPC industry than the 3D Web,” said Justin Rattner, Intel CTO, in a keynote talk at the SC’09. “The 3D Web will be the technology driver that revitalizes the HPC business model.”
And not only that, it will also revitalize the way we understand Big Data. The 3D Web promises to deliver more more intuitive data visualization than we’ve ever seen before, and that can only lead to one thing – even greater insights, and even faster learning.
After all, as Dr. Maples points out, no one knows for sure what’s really inside their data. “That’s the miraculous thing,” he said. “Even the people who think they know, I can guarantee you there will always be surprises.”